B2B eCommerce KPIs That Define Success in 2026

When it comes to B2B eCommerce KPIs, you can’t use the same rulebook borrowed from the direct to consumer world. Metrics like website traffic, conversion rate, cart abandonment, and AOV make sense in retail where the buying journey is short, the decision-maker is singular, and success hinges on optimizing the funnel.
B2B eCommerce, however, operates under an entirely different reality. Buyers don’t follow linear funnels. Purchases often require multiple stakeholders, negotiated pricing, contractual terms, custom configurations and post-purchase workflows. The value of digital isn’t simply in completing a transaction, it’s in enabling how organizations sell, serve and support customers at scale.
That means B2B commerce KPIs must evolve.
Instead of asking, “How many customers converted online?” The more strategic question is: “How effectively is digital strengthening sales productivity, reducing cost-to-serve and accelerating revenue cycles?”
Below are the four categories of B2B eCommerce KPIs that define success in 2026 and beyond.
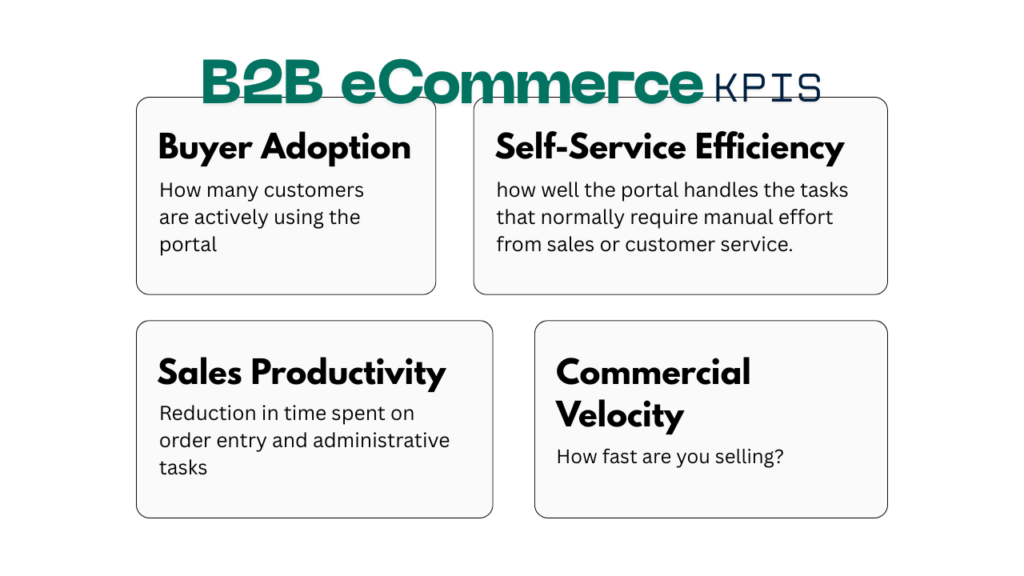
1. Buyer Adoption
A portal has no impact if customers aren’t using it. Adoption, measured through posture rather than vanity numbers is now the most important eCommerce health metric.
Forward-thinking organizations track:
- % of accounts onboarded to digital self-service
- % of repeat orders placed through the portal
- Digital share of wallet within existing accounts
- Buyer engagement depth (saved lists, quotes created, reorder frequency)
These metrics reveal behavior change. When customers adopt digital commerce, it frees up reps and increases operational efficiency.
Adoption also becomes a leading indicator of expansion revenue. In my experience, digitally engaged buyers buy more frequently, explore more SKUs and participate more actively in new programs such as subscriptions, bundling or dynamic pricing.
If a portal is live but adoption is low, you have a value communication problem.
2. Self-Service Efficiency
B2B eCommerce teams often only measure how much customers are doing online.
What they should also focus on is how well the portal handles the tasks that normally require manual effort from sales or customer service.
Key metrics include:
- Quote-to-order automation rate
- % of order changes processed without rep intervention
- Customer-service tickets deflected by self-service
- Time-to-order for repeat purchases
- Success rates for tasks like reorders, contract pricing access or specification downloads
These KPIs quantify operational efficiency.
When a portal can intelligently handle pricing rules, configurations, account hierarchies and approval workflows, it becomes a true digital co-pilot for the sales team. And unlike human capacity, portal capacity scales infinitely.
In many organizations, digital self-service efficiency is now directly tied to EBITDA improvement—because reducing friction in fulfillment, order entry and support flows improves margins without increasing headcount.
3. Sales Productivity
B2B eCommerce was never meant to replace sales reps—it was meant to make them more effective.
Unfortunately, most organizations still measure eCommerce in a silo, disconnected from sales performance. But the most transformative businesses I work with now evaluate digital success based on rep productivity indicators such as:
- Reduction in time spent on order entry and administrative tasks
- Increase in accounts per rep managed efficiently
- Cycle-time reduction for quote approvals
- Uptick in rep-led digital orders (orders initiated by reps on behalf of customers)
- Lift in cross-sell and upsell driven by digital recommendations
When sales reps rely on the portal as their operations center—building quotes, configuring products, visualizing pricing scenarios or placing orders on behalf of customers—you know digital transformation is working.
The portal becomes a revenue tool, not just a transaction terminal.
In 2026, sales productivity should become one of the most reliable indicators of whether your eCommerce platform is creating enterprise-level impact.
4. Commercial Velocity
Revenue alone can’t tell you if digital commerce is delivering strategic value. The more important question is: Are we selling faster?
Commercial velocity metrics capture the speed at which customers progress through their buying journey and the organization executes behind the scenes:
- Time from quote creation to order submission
- Time from order to fulfillment confirmation
- Approval cycle times for B2B workflows
- Lead-to-opportunity and opportunity-to-close speed for digitally influenced deals
- Lag time between product discovery and first purchase
Slow cycles kill margins. They frustrate buyers and create unnecessary pressure on sales and operations teams.
A good digital experience supported by automation and integrated workflows should shrink cycle times dramatically.
Commercial velocity is the KPI CFOs and COOs increasingly track to evaluate the broader organizational value of digital commerce.
To wrap it up…
In 2026, B2B leaders must rethink the metrics that guide their digital investments.
The organizations pulling ahead today are those that measure:
- Adoption (Are customers using it?)
- Efficiency (Is it doing work for us?)
- Productivity (Is it empowering our sales team?)
- Velocity (Are we selling faster?)
These are the metrics that reveal whether eCommerce is functioning as a strategic lever for the business.
As more manufacturers and distributors rebuild their commercial engines around digital tools, the winners will be the companies that know how to measure what truly matters.
Schedule a call for B2B eCommerce Consulting